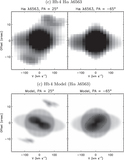
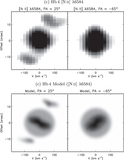
Image Details

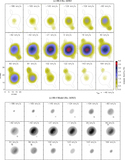
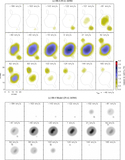
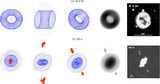
Caption: Figure 1. Spatial distribution maps
The complete figure set (28 images) is available in the online journal.
From left to right, spatial distribution maps of the logarithmic flux intensity, continuum, LSR velocity, and velocity dispersion of the Hα λ6563 and [N II] λ6584 emission lines for: (a) PB 6, (b) M 3-30, (c) Hb 4, (d) IC 1297, (e) Pe 1-1, (f) M 1-32, (g) M 3-15, (h) M 1-25, (i) Hen 2-142, (j) K 2-16, (k) NGC 6578, (l) NGC 6567, (m) NGC 6629, and (n) Sa 3-107. Fluxes are in logarithm of 10−15 erg s−1 cm−2 spaxel−1 unit, continua are in 10−15 erg s−1 cm−2 Å−1 spaxel−1, and LSR velocities and velocity dispersions are in km s−1. The white/black contour in each panel corresponds to ∼10% of the mean surface brightness of each object in the Hα emission (or R-band) retrieved from the SHS (or SSS). North is up, and east is toward the left-hand side.
Other Images in This Article

Copyright and Terms & Conditions
© 2022. The Author(s). Published by the American Astronomical Society.