Image Details
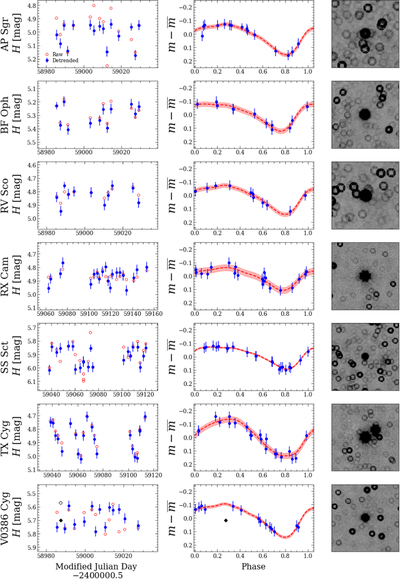
Caption: Figure 4.
Raw (open red circles) and detrended (left) and phased (center) light curves (filled blue circles) and models (dashed red lines), plus reference images (right, ﹩4^{\prime} ﹩ on a side, inverted for clarity) of our target Cepheids. The mean magnitudes used in the left column were taken from 2MASS PSC. Phased light curves are plotted relative to the mean magnitude of each light curve, and the models are shown with 1σ intervals (shaded red regions). Observations taken within 2.4 hr were averaged into a single epoch. Periods were taken from Riess et al. (2021). The black diamonds in the V0386 Cyg light curves correspond to an epoch that was excluded due to a significant difference in defocused PSF size compared to all other images.
Other Images in This Article


Copyright and Terms & Conditions
© 2022. The Author(s). Published by the American Astronomical Society.