Image Details
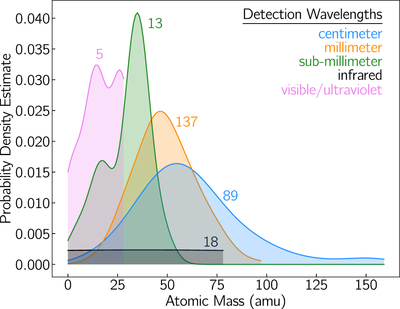
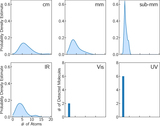
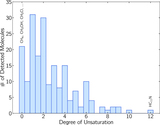
Caption: Figure 7.
Kernel density estimate (KDE) analysis of molecules detected in each of the given wavelength ranges (excepting the fullerenes), generated with a bandwidth = 0.5. In some cases, the initial detection was reported in two or more wavelength ranges (see text), and credit was given to each for this analysis. The number of samples in each wavelength range is given next to the corresponding trace in the plot. The frequency ranges for centimeter, millimeter, and submillimeter used were 0–50, 50–300, and 300+ GHz, respectively.
Other Images in This Article
Show More
Copyright and Terms & Conditions
© 2022. The Author(s). Published by the American Astronomical Society.
Copyright ©
2026 Astronomy Image Explorer. All Rights Reserved.