Image Details
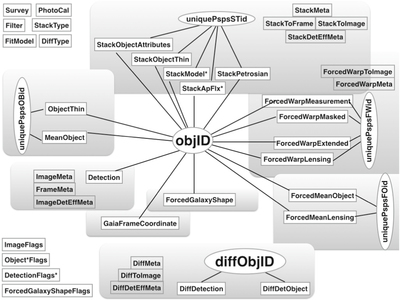
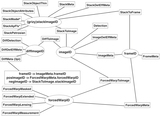
Caption: Figure 9.
A summary of how the different tables are related. The rectangular boxes with words inside represent the different table names. The ovals with words inside represent the column names to use to join the tables. Black lines connect table names to columns (i.e., Detection has a line to ObjID, which has a line to StackObjectThin)—this shows that Detection can be joined to StackObjectThin using ObjIDaq. The gray rounded boxes represent different stages of data processing, which corresponds to different stages of loading into the database. Tables within the gray boxes are related; connections to the (gray) metadata tables are shown in Figure 9. The tables that are not in gray rounded boxes represent system metadata, metadata that describes the Pan-STARRS1 system as well as flag information.
Other Images in This Article


Copyright and Terms & Conditions
© 2020. The American Astronomical Society. All rights reserved.