Image Details
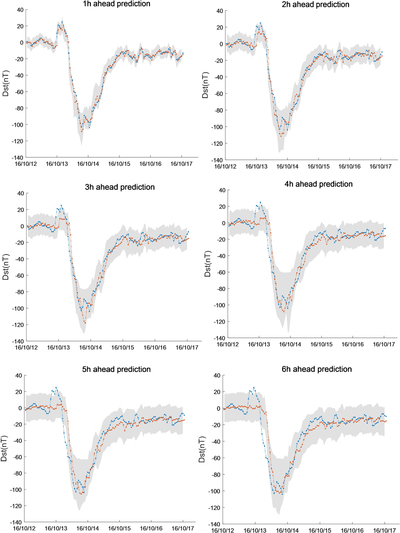
Caption: Figure 5.
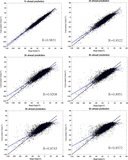
Prediction of results in a geomagnetic storm event. The blue dotted curves present the real Dst, and the dotted curves display the prediction Dst of our model. The gray shaded area displays the results of interval prediction.
Other Images in This Article
Copyright and Terms & Conditions
© 2020. The Author(s). Published by the American Astronomical Society.
Copyright ©
2025 Astronomy Image Explorer. All Rights Reserved.