Image Details
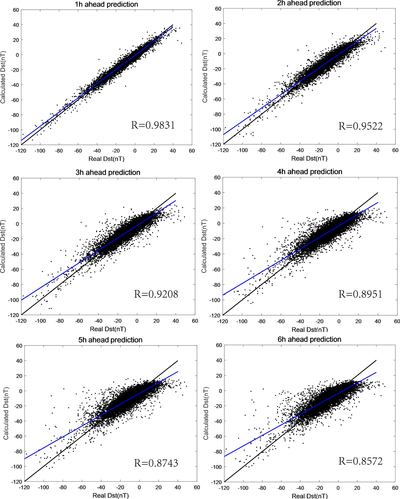
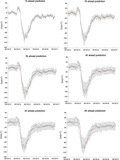
Caption: Figure 4.
Comparison between the prediction Dst values based on the Bagging ensemble-learning algorithm and the real Dst values. The blue line presents the fitted result, and the black line is the linear curve (i.e., real Dst = prediction Dst).
Other Images in This Article
Copyright and Terms & Conditions
© 2020. The Author(s). Published by the American Astronomical Society.
Copyright ©
2025 Astronomy Image Explorer. All Rights Reserved.