Image Details
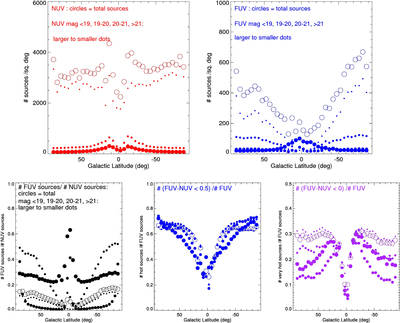
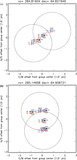
Caption: Figure 6.
Top: number of sources per square degree detected in NUV (left) and in FUV (right), as a whole (circles) or by magnitude ranges (dots). Values are shown for every 5° latitude strip. Bottom: fraction of FUV detections over NUV detections (left), and fraction of sources with FUV–NUV < 0.5 (middle), and <0.0 (right) among the FUV detections (no error cuts, but sources in the footprint of extended objects have been excluded from the counts). While the faint sources (largely extragalactic) dominate the total samples, the FUV-detected sources are mostly bright stars. We recall that, for average Galactic dust, the UV extinction is similar in FUV and NUV, and much higher in both bands than at optical wavelengths (Table 1 and Bianchi 2011).
Other Images in This Article

Show More
Copyright and Terms & Conditions
© 2017. The American Astronomical Society. All rights reserved.