Image Details
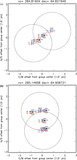
Caption: Figure 5.
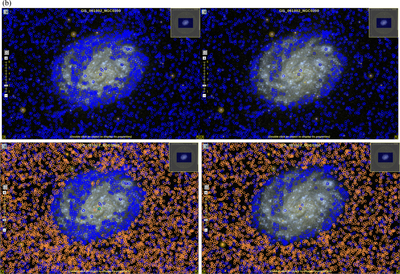
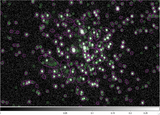
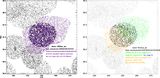
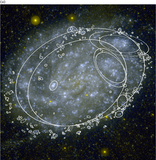
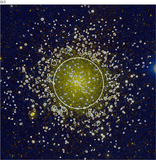
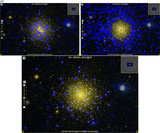
(a) Example of pipeline photometry for an extended disk galaxy, NGC 300 (D25 ≈ 0.°2). The central parts of the disk are measured by the pipeline as unresolved extended sources; in the periphery and less dense regions, where individual peaks are resolved, the source density is much higher than that in the surrounding field. Therefore, density counts of foreground stars or background AGNs, for example, will be highly biased if sources in this region were not excluded. We marked all sources retained in GUVcat (duplicate measurements are removed) and associated with NGC 300 by our inlargeobj flag (within 1.25X D25). The source shape is drawn, with an ellipse based on the pipeline-derived ﹩2.35\times {nuv}\_a\_{world}﹩, ﹩2.35\times {nuv}\_b\_{world}﹩ (this choice is to match the pipeline .ds9reg file), nuv_theta (position angle). They may appear different using kron_radius × ﹩{nuv}\_a\_{world}﹩, which would show the area where the mag_auto are integrated. Aside from details and differences among various magnitude extraction options, which can be examined in the catalog, the figure illustrates convincingly that pipeline photometry in very extended galaxies must not be used for source counts. The GUVcat tag inlargeobj allows sources in these areas to be excluded. Note that some large sources have two measurements: these come from two overlapping AIS observations, which placed the centers of the big ellipses more that 2.″5 apart from each other, therefore they were not eliminated as duplicates in GUVcat. The image is 1455″ on a side. (b) GALEX pipeline sources in the master database around NGC 300: AIS as blue circles, NGS (about two mag deeper than AIS; see Bianchi 2009) as orange circles. Note that here duplicates have not been removed, and all measurements are shown, making the sources appear more numerous than in GUVcat (previous figure). There is an even deeper GI observation that is not shown, for clarity. The left panels show all entries in the master database, and the right panels only show those with NUV_err ≤ 0.5 (as in GUVcat, which eliminates some spurious sources and many artifacts). (c) Example of pipeline photometry for a crowded stellar cluster, NGC 6218. Sources retained in GUVcat are drawn, as in the Figure 5(a), according to their database photometry extraction parameters. The color image was constructed for all available imaging for the field, including deeper exposures. Clearly visible blue sources in the cluster are only detected by the pipeline in FUV (and therefore are not retained in GUVcat, which uses as a starting point the NUV source detections); see the next figure. The large circle shows the pipeline aperture of the central source (drawn as explained in the previous figure), taken from NUV, showing how the pipeline neither provides accurate integrated measurements nor robust crowded-field measurements of resolved stars in the cluster. The image is 1332″ on a side. (d) AIS detections in the master database for NGC 6218 (only source centers shown, not source shapes). Top: FUV detections (left) and NUV detection (right); bottom: sources detected in both FUV and NUV. Note that from the shape of the pipeline sources shown in the previous figure, matching FUV and NUV colors in the central region would not be correct, even for sources where a match exists.
Other Images in This Article

Show More
Copyright and Terms & Conditions
© 2017. The American Astronomical Society. All rights reserved.
Copyright ©
2025 Astronomy Image Explorer. All Rights Reserved.