Image Details
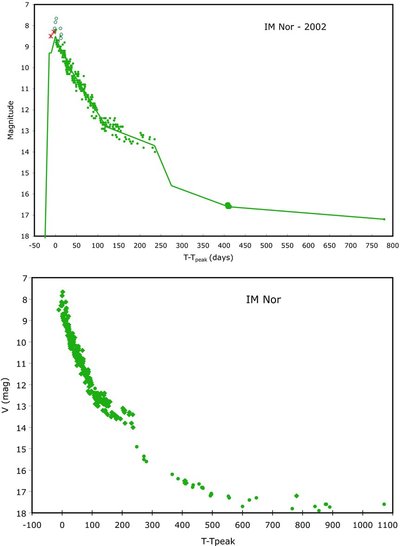
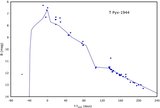
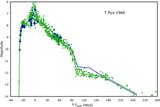
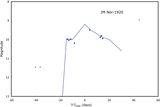
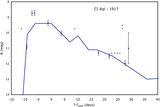
Caption: Figure 7.
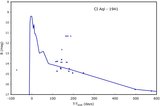
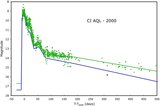
IM Nor in 2002. In the upper panel, the small filled circles are for visual observations from the AAVSO or the IAU Circulars, while the large circles are CCD photometry from Woudt & Warner (2003). The asterisks at the very start are red band magnitudes from Liller, while the empty circles are other photographic observations of Liller with an unknown color sensitivity. In the lower panel, the unfiltered-CCD magnitudes of Monard are included with a shift of 0.6 mag so as to match the light curve over the first 400 days. The inclusion of these data provides a clear picture of the light curve from before the peak all the way past the return to quiescence over 900 days later. Indeed, with this, we see a sharp drop-off starting at 235 days immediately after a flattening from 110–235 days. With this, it appears that IM Nor has a plateau from 110–235 days after peak.
Other Images in This Article
Show More
Copyright and Terms & Conditions
© 2010. The American Astronomical Society. All rights reserved.