Image Details
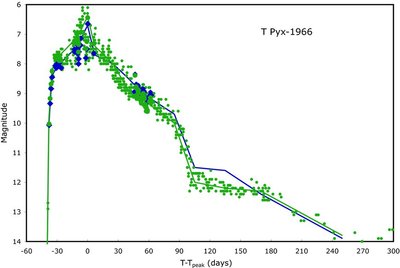
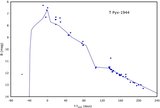
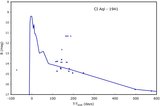
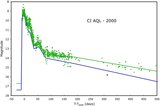
Caption: Figure 5.
T Pyx in 1966. The diamonds are for B-band magnitudes, while the circles are for V-band magnitudes. The small circles are for visual observations, while the large symbols are for photoelectric observations. The broken lines indicate the templates for the B band and the V band (see Table 16), with the V-band template lying on top around the time of peak. The T Pyx light curve has observed fast oscillations with an amplitude of >0.8 mag on time scales of a day or less, and this causes the large apparent scatter about the templates in the light curves.
Other Images in This Article
Show More
Copyright and Terms & Conditions
© 2010. The American Astronomical Society. All rights reserved.
Copyright ©
2026 Astronomy Image Explorer. All Rights Reserved.