

Image Details
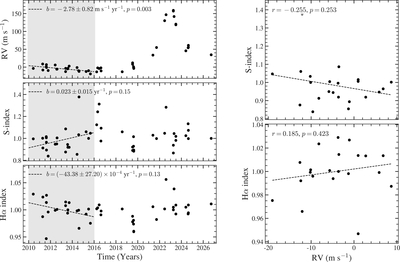
Caption: Figure 4.
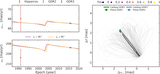
Long-term evolution of the PFS RVs (top left), Ca II S-index (middle left), and Hα index (bottom left) for HIP88962, together with the correlations between the contemporaneous RVs and the two activity indicators during 2010–2015 (right panels). The shaded region marks the 2010–2015 interval discussed in the text. The dashed lines in the left panels show independent linear fits over this interval, with the fitted slopes and corresponding p-values indicated. The RVs show a statistically significant downward trend, whereas neither activity indicator shows a significant temporal trend. The right panels compare the original RVs directly with the S-index and Hα index over the same interval; the dashed lines show linear fits, and the Pearson correlation coefficients and corresponding p-values are indicated. Neither activity indicator shows a significant correlation with the RVs.
Other Images in This Article
Copyright and Terms & Conditions
© 2026. The Author(s). Published by the American Astronomical Society.

