

Image Details
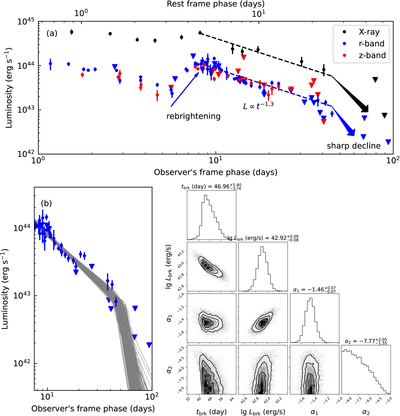
Caption: Figure 3.
(a) The host-subtracted optical light curves of the transient EP241021a in the r and z bands, along with the X-ray light curves during and after the plateau phase. The data were taken from X. Shu et al. (2025) and M. Busmann et al. (2025). The rebrightening, the subsequent power-law decay, and the final sharp decline are labeled in both bands. (b) The broken power-law models that fit the r-band data after a phase of 7.5 days. We present 200 randomly selected MCMC realizations for clarity. (c) The posterior distributions for each model parameter.
Other Images in This Article
Copyright and Terms & Conditions
© 2026. The Author(s). Published by the American Astronomical Society.

Copyright ©
2026 Astronomy Image Explorer. All Rights Reserved.
