

Image Details
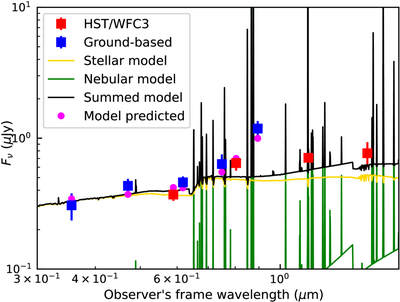
Caption: Figure 2.
The SED of the host galaxy and the best-fitting CIGALE model. Red and blue squares indicate data from HST and ground-based observations. The stellar and nebular components, and the summed model, are shown as yellow, green, and black lines, respectively. The model-predicted photometries are shown as magenta points for comparison.
Other Images in This Article
Copyright and Terms & Conditions
© 2026. The Author(s). Published by the American Astronomical Society.

Copyright ©
2026 Astronomy Image Explorer. All Rights Reserved.
