

Image Details
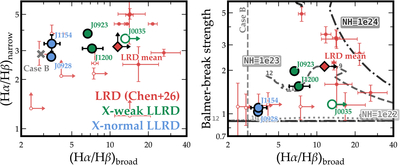
Caption: Figure 4.
Balmer diagnostics support X-normal/weak division and moderate (NH ∼ 1022−23 cm−2) obscuration of X-weak LLRDs. Left: broad vs. narrow Hα/Hβ. Right: Balmer-break strength vs. broad-Hα/Hβ. Red, green, and blue symbols denote LRDs from C.-H. Chen et al. (2026), X-weak LLRDs, and X-normal LLRDs, respectively. Arrows indicate limits, diamonds mark representative LRD average, and gray symbols indicate Case B. Curves in the right panel show the dense-gas calculation from Z. Yan et al. (2026): boxed labels identify NH for each track, while numbers along the tracks give nH in logarithm cm−3.
Other Images in This Article
Copyright and Terms & Conditions
© 2026. The Author(s). Published by the American Astronomical Society.

Copyright ©
2026 Astronomy Image Explorer. All Rights Reserved.
