

Image Details
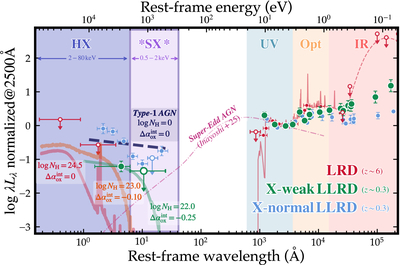
Caption: Figure 3.
Normalized IR–optical–UV–X-ray SEDs of the X-weak LLRDs (green), X-normal LLRDs (blue), and high-redshift LRDs (red). All SEDs are normalized at the rest-frame 2500 Å. The LLRD measurements combine EP-FXT X-ray spectroscopy with GALEX, Sloan Digital Sky Survey (SDSS), SPHEREx, and Wide-field Infrared Survey Explorer (WISE) photometry. The red measurements and background SED model show the stacked LRD constraints from H. B. Akins et al. (2025). The curves show a typical unobscured super-Eddington model with ﹩\dot{m}=1﹩ and MBH = 107 M⊙ (K. Inayoshi et al. 2025); a CT model with NH = 1024.5 cm−2 and Δαox = 0; a Compton-thin model with NH = 1023 cm−2 and Δαox = −0.10; the fitted X-weak LLRD model with NH = 1022 cm−2 and Δαox = −0.25; and an unabsorbed local-AGN model with Δαox = 0.
Other Images in This Article
Copyright and Terms & Conditions
© 2026. The Author(s). Published by the American Astronomical Society.

