

Image Details
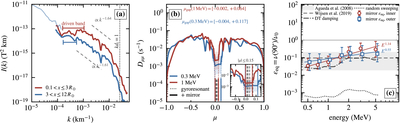
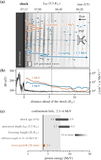
Caption: Figure 2.
The slab spectrum, the pitch-angle diffusion coefficient, and the equivalent 90° constant. (a) Slab spectrum I(k), the median over the inner (red) and outer (blue) precursor, with the Welch spectrum of the 3–20 R⊙ record (light blue). Bars mark the driven bands, dashed lines the fitted falls beyond them, and the dotted line kdi = 1. (b) Dμμ at 0.3 MeV (blue) and 1 MeV (red) on the inner median field, gyroresonance alone (dotted) and with the mirror interaction at ηTTD = 1 (solid), shaded over ηTTD = 0.3–3. Ticks along the bottom axis mark the gyroresonant edges, solid for the measured branches and gray for a nondispersive field of the same bandwidth, and the inset enlarges ∣μ∣ ≤ 0.15. (c) ϵeq per region, medians over the 15 s samples with 16th–84th bars, circles inner and squares outer, with fitted slopes at the right. The dynamical-turbulence damping (DT) and random-sweeping curves use the inner median field. The band and the dashed line mark the constants of N. Agueda et al. (2008) and N. Wijsen et al. (2019) at ϵeq = 2ϵ, and the thin line ϵeq = 1.
Other Images in This Article
Copyright and Terms & Conditions
© 2026. The Author(s). Published by the American Astronomical Society.

