

Image Details
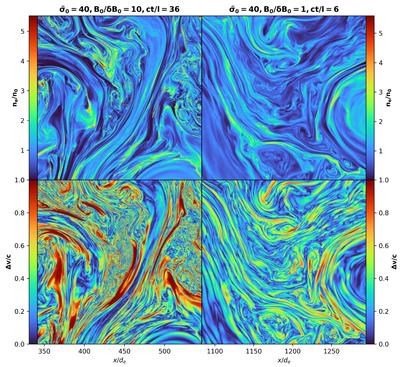
Caption: Figure 1.
On the left, the electron density ne and the velocity associated with the current Δv = J/en are given in a portion of the simulation domain for the case of B0/δB0 = 10. On the right, the same quantities are given for the case of B0/δB0 = 1. Both regions are about 200de in length, and were chosen to illustrate the multiscale nature of turbulence. Though the electron density in the strong-mean-field case reaches higher values, we limit both colorbars to the same range to aid visual comparison. Note the sharper density gradients and richer small-scale structure of the turbulence in the case of a strong guide field, as well as the relative intensity and frequency of charge-starved regions (where Δv/c ≈ 1).
Other Images in This Article
Copyright and Terms & Conditions
© 2026. The Author(s). Published by the American Astronomical Society.

