

Image Details
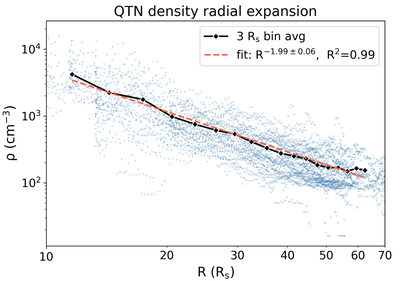
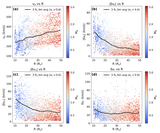
Caption: Figure C1.
The radial density profile of QTN data. The black line shows the 3 Rs averaged data. The red dashed line is the result from least-squares linear fitting of the averaged data.
Other Images in This Article
Copyright and Terms & Conditions
© 2026. The Author(s). Published by the American Astronomical Society.

Copyright ©
2026 Astronomy Image Explorer. All Rights Reserved.
