

Image Details
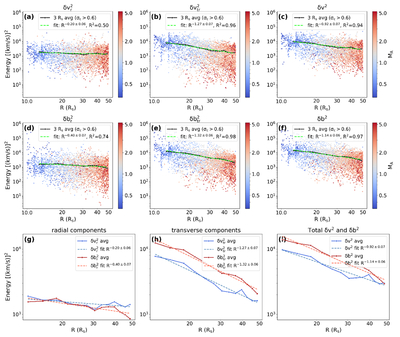
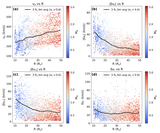
Caption: Figure 6.
Radial evolution of magnetic and velocity fluctuation energy. The scatter points are colored by Alfvén Mach number MA. Panels (a) and (d) are for the radial component, panels (b) and (e) are for the transverse component, and panels (c) and (f) are for the sum of all components. The solid black lines exhibit the averaged data by 3 Rs bins. The green dashed lines are the results from least-squares linear fitting of the averaged data. Panels (g), (h), and (i) show the comparisons of linear fitting results for the three columns.
Other Images in This Article
Copyright and Terms & Conditions
© 2026. The Author(s). Published by the American Astronomical Society.

Copyright ©
2026 Astronomy Image Explorer. All Rights Reserved.
