

Image Details
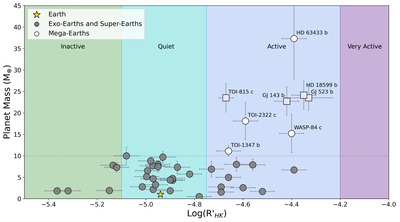
Caption: Figure 3.
Planet mass versus stellar activity indicators (here log﹩{R}_{\mathrm{HK}}^{{\prime} }﹩) for 37 planets consistent with rocky planet densities (circles). Planets with a mass below that of the runaway gas-accretion threshold (10 M⊕) are shown in gray, while those above this limit are shown in white, delimited by a gray dotted line. Regions of high, very high, and low activity are highlighted (T. J. Henry et al. 1996), with the Vaughan–Preston gap delimiting active and inactive stars. Planets consistent with volatile-rich compositions (GJ 523 b, GJ 143 b, TOI-815 c, and HD 18599 b) are shown with lavender squares to distinguish them from those in the rocky planet density regime.
Other Images in This Article
Copyright and Terms & Conditions
© 2026. The Author(s). Published by the American Astronomical Society.

