

Image Details
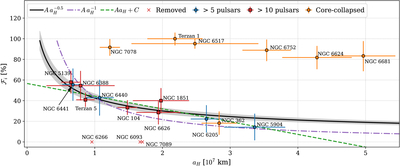
Caption: Figure 1.
Fraction of isolated MSPs in GCs as a function of the threshold orbital separation aH. Smaller values of aH shift the hard–soft boundary to smaller orbital separations so that even relatively compact binaries fall in the soft, ionizable regime (i.e., a ≳ aH) and are disrupted through encounters. Non-core-collapsed clusters with more than 10 detected MSPs are shown with red squares, while those with more than 5 are shown with blue squares. Lines of different colors show the three simplest models tested (see Table 3), each fitted to the non-core-collapsed clusters (red squares and blue circles); the shaded gray region marks the 1σ confidence interval of our fiducial model, ﹩A\,{a}_{{\rm{H}}}^{-0.5}﹩ (black line).
Other Images in This Article
Copyright and Terms & Conditions
© 2026. The Author(s). Published by the American Astronomical Society.

