

Image Details
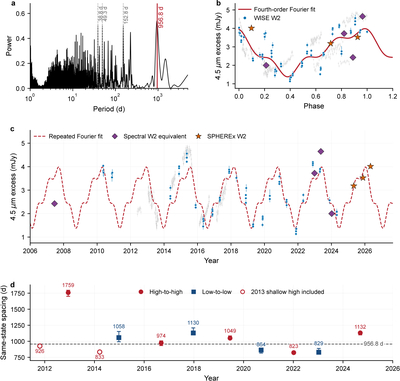
Caption: Figure 2.
Recurrent infrared variability and its cycle-to-cycle changes. (a) Lomb–Scargle periodogram of the combined WISE W1/W2 light curve. The red line marks Prec = 956.8 days and gray dashed lines mark the principal aliases. (b) W2-equivalent excesses on the common CK04 photospheric scale, folded at the mean recurrence timescale. The red curve is a weighted fourth-order Fourier fit to the complete dataset. Gray points, blue circles, purple diamonds, and orange stars denote Spitzer [4.5], WISE W2, spectroscopic W2-equivalent, and SPHEREx W2-equivalent measurements, respectively. (c) Full 4.5 μm excess record as a function of time. The dashed red curve is the same fourth-order Fourier fit repeated at the recurrence timescale. (d) Spacings between successive high states or successive low states, plotted at the temporal midpoint of each pair. Open red circles show the alternative spacings obtained when the shallow 2013 Spitzer maximum is treated as an additional high state. The spacings vary nonmonotonically around the mean recurrence timescale marked by the dashed line.
Other Images in This Article
Copyright and Terms & Conditions
© 2026. The Author(s). Published by the American Astronomical Society.

