

Image Details
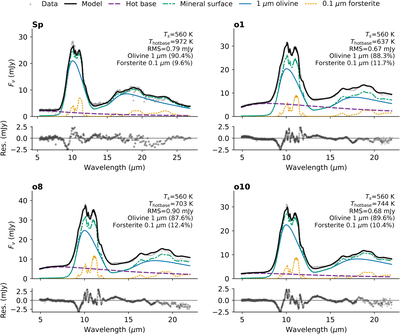
Caption: Figure 1.
Dust-emission decomposition of ID8 at four epochs. Spitzer (Sp) and JWST/MIRI (o1, o8, and o10) spectra are fitted with the two-temperature dust model in Equation (1) after subtraction of the stellar photosphere. The mineral surface is fixed at 560 K, representative of the 550–577 K range from the broad multisize fits. Gray points show the data. The black curves show the total model, while the purple dashed, green dashed–dotted, blue, and orange dotted curves show the hot-base continuum component, total optically thin mineral emission, combined 1 μm olivine/Mg-olivine emission, and combined 0.1 μm forsterite emission, respectively. The grouped mineral fractions remain stable, while the hot-base continuum component varies strongly.
Other Images in This Article
Copyright and Terms & Conditions
© 2026. The Author(s). Published by the American Astronomical Society.

