

Image Details
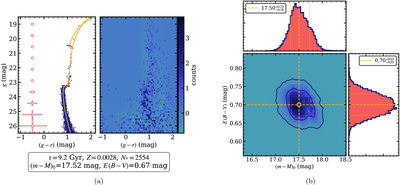
Caption: Figure B1.
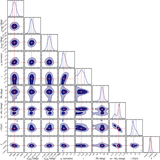
(a) The left panel shows an example of a stellar population simulated along an isochrone according to a G. Chabrier (2001) IMF. The age, metallicity, distance modulus, reddening and the number of stars are shown in the legend. The right panel shows the observed Hess diagram around Rubin-GC1 made from stars within a 2′ aperture compared to a background annulus of ﹩18\text{'}\lt r\lt 30\text{'}﹩. (b) The distributions of the reddening and distance modulus obtained from fitting 250,000 realizations of a simulated stellar population to the observed Hess diagram. The 1σ and 2σ contours are plotted in dark blue. The median E(B − V) and (m − M)0 values are labeled and marked by yellow dashed lines.
Other Images in This Article
Copyright and Terms & Conditions
© 2026. The Author(s). Published by the American Astronomical Society.

