

Image Details
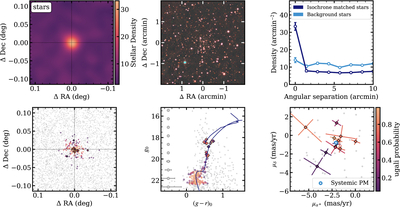
Caption: Figure 1.
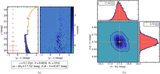
Diagnostic plots for Rubin-GC1. The top left panel shows a smoothed isochrone-filtered stellar density map. The top middle panel shows the Rubin DP2 coadded image of Rubin-GC1 made with the g-, r-, i-bands. The top right panel shows a radial stellar density profile with isochrone-filtered stars shown in dark blue and background stars that do not fall within the isochrone filter shown in light blue. The bottom left panel shows the spatial distribution of stars with ugali membership probability >0.05. Stars with a membership probability <0.05 are shown as gray points. The bottom middle panel shows a color–magnitude diagram of stars within 2′ of the centroid of Rubin-GC1. The dark blue line shows the best-fit isochrone. The 12 stars with proper motions consistent with that of Rubin-GC1 from Gaia DR3 are shown as diamonds with black outlines in all three panels in the second row (see Section 4.1 for details). These are also shown in the bottom right panel. The blue circle shows the systemic proper motion of Rubin-GC1. Note that two of the 12 stars with Gaia DR3 proper motions are superimposed upon each other, and a third star overlaps with the systemic proper-motion marker.
Other Images in This Article
Copyright and Terms & Conditions
© 2026. The Author(s). Published by the American Astronomical Society.

