

Image Details
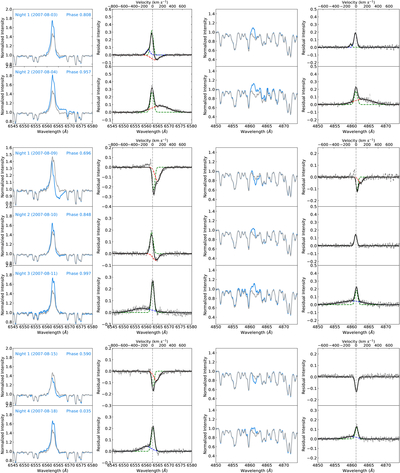
Caption: Figure 2.
The Hα (left two columns) and Hβ (right two columns) line profiles for the three flare events. Columns (1) and (3) show the observed spectra (royal blue) with the reference spectrum overplotted (gray), while columns (2) and (4) show the residual spectra (gray dots) after subtraction of the reference, along with multi-Gaussian fits (dashed lines). The rows correspond to the multinight evolution of Event I (top), Event II (middle), and Event III (bottom), with observing dates and orbital phases labeled.
Other Images in This Article
Copyright and Terms & Conditions
© 2026. The Author(s). Published by the American Astronomical Society.

Copyright ©
2026 Astronomy Image Explorer. All Rights Reserved.
