

Image Details
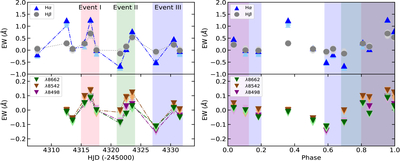
Caption: Figure 1.
Measurements of the EWs of the residual Hα, Hβ, and Ca II IRT (λ8498, λ8542, λ8662) line profiles versus HJD (left panel) and orbital phase (right panel). Different colors represent distinct chromospheric activity indicators. Measurements derived from the coadded spectra are shown in darker colors, while those from the individual subexposures are shown in lighter colors of the same hue, illustrating the consistency of the EW measurements across the subexposures. The shaded colored regions in both panels mark the three successive flare events (Events I, II, and III).
Other Images in This Article
Copyright and Terms & Conditions
© 2026. The Author(s). Published by the American Astronomical Society.

Copyright ©
2026 Astronomy Image Explorer. All Rights Reserved.
