

Image Details
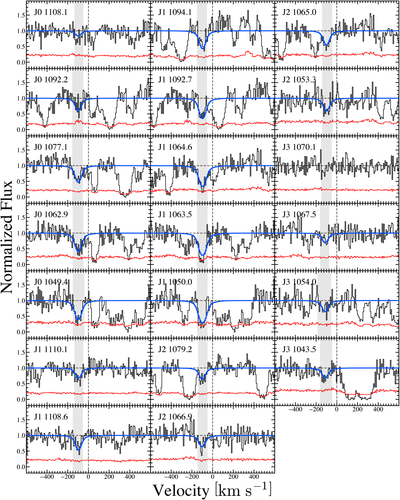
Caption: Figure B1.
The complete figure set (6 images) is available in the online journal.
Spectrum and Voigt profile fits of H2 absorption features. The transition level and rest-frame wavelength are shown in the upper left of each panel. The normalized spectrum and uncertainties are shown in black and red, respectively. The Voigt profiles fit to the spectra are shown in blue. The gray shaded region indicates the range used to calculate Wr.
Other Images in This Article
Copyright and Terms & Conditions
© 2026. The Author(s). Published by the American Astronomical Society.

Copyright ©
2026 Astronomy Image Explorer. All Rights Reserved.
