

Image Details
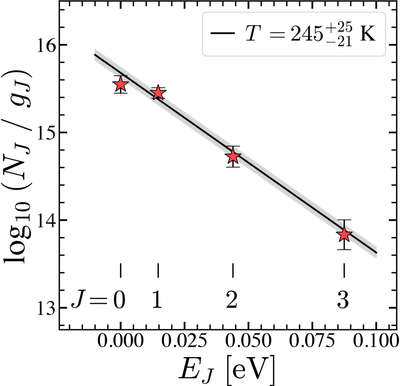
Caption: Figure 3.
Excitation diagram of H2. The energy of each excitation level (J) is indicated at the bottom of the figure. The line of best fit is shown in black, with the corresponding temperature shown in the legend. The uncertainty in the temperature is shown as a gray shaded region.
Other Images in This Article
Copyright and Terms & Conditions
© 2026. The Author(s). Published by the American Astronomical Society.

Copyright ©
2026 Astronomy Image Explorer. All Rights Reserved.
