

Image Details
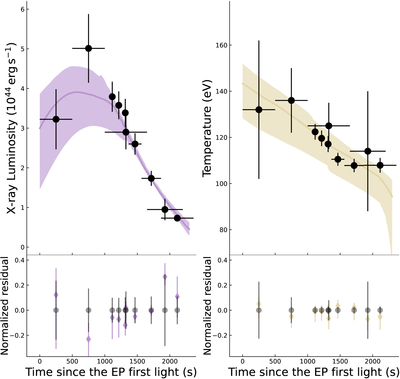
Caption: Figure 4.
Best-fit extended-CSM model compared to the observations of EP260321a. Upper left: X-ray luminosity curve in the 0.4–2.0 keV band. Upper right: time evolution of the radiation temperature. Filled black circles present the X-ray luminosity and temperature adopted from W. Yuan et al. (2026). Phases are given relative to the first detection by EP at T0 = 2026-03-21 12:16:08 UTC, or MJD 61120.511 (W. Yuan et al. 2026). Solid lines show the best-fit model predictions, with the parameters Eej = 7.0 × 1051 erg, Rin = 141 R⊙, Rout = 580 R⊙, and ﹩{{\rm{log}}}_{10}({M}_{{\rm{csm}}}/{M}_{\odot })=-3.4﹩. The purple and yellow shaded regions indicate the 68% posterior predictive ranges. The lower panels show the normalized residuals. The purple and yellow diamonds represent the normalized residuals of the model fit, while the error bars on the gray circles indicate the uncertainties of the data themselves.
Other Images in This Article
Copyright and Terms & Conditions
© 2026. The Author(s). Published by the American Astronomical Society.

