

Image Details
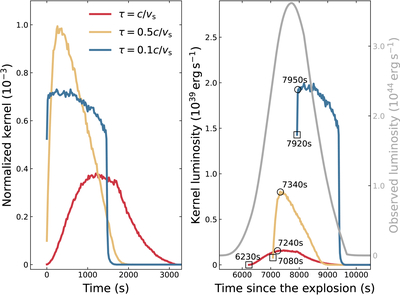
Caption: Figure 2.
For illustration purposes, only three diffusion kernels are displayed corresponding to the optical depths at which photons are injected, namely τ = c/vs (red line), τ = 0.5c/vs (yellow line), and τ = 0.1c/vs (blue line), respectively. The left panel presents the kernel profiles, which have been normalized so that each integrates to unity. The right panel displays the observed light curves resulting from photons diffusing out of the CSM at the three corresponding optical depths. The black open squares mark when photons are injected into the unshocked CSM at each optical depth, while the black open circles indicate when the corresponding light curves reach their peak. The gray line shows the observed light curve, synthesized by integrating the contributions from all kernels as the shock propagates through the outer boundary of the CSM.
Other Images in This Article
Copyright and Terms & Conditions
© 2026. The Author(s). Published by the American Astronomical Society.

