

Image Details
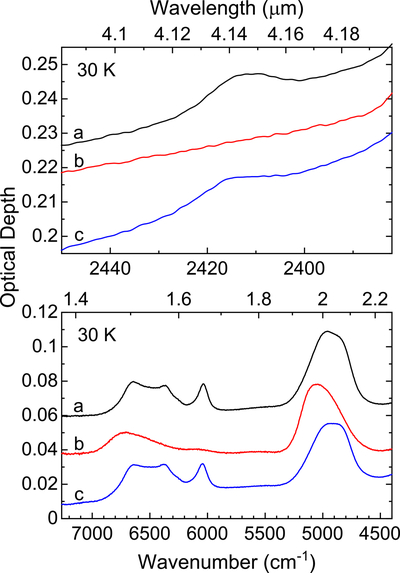
Caption: Figure 5.
Infrared spectra of the HDO absorption band (top) and H2O absorption bands (bottom) of a 6.18 × 10¹⁸ H2O cm−2 (2.17 μm) crystalline sample before (a), after irradiating with 10 keV electrons to a fluence of 1 × 10¹⁷ electrons cm−2 at 30 K (b), and after heating the irradiated sample to 160 K and recooling it to 30 K (c). The spectra have been vertically offset for clarity.
Other Images in This Article
Copyright and Terms & Conditions
© 2026. The Author(s). Published by the American Astronomical Society.

Copyright ©
2026 Astronomy Image Explorer. All Rights Reserved.
