

Image Details
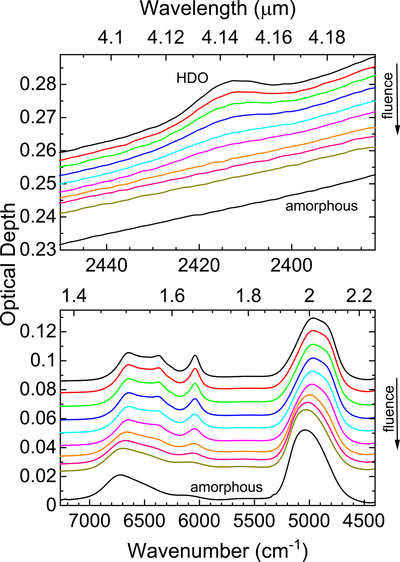
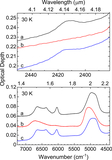
Caption: Figure 1.
Infrared spectra of the HDO absorption band (top) and H2O absorption bands (bottom) of a 6.18 × 10¹⁸ H2O cm−2 (2.17 μm) crystalline sample during irradiation with 10 keV electrons at 50 K, compared to an amorphous H2O-ice sample of similar thickness grown at 50 K. The curves (from top to bottom in both panels, displaced vertically for clarity) correspond to fluences of 0, 0.95, 2.61, 6.95, 28.0, 101, 341, 510, and 1590 × 1014 electrons cm−2. The bottom panel has been adapted from M. J. Loeffler et al. (2020).
Other Images in This Article
Copyright and Terms & Conditions
© 2026. The Author(s). Published by the American Astronomical Society.

Copyright ©
2026 Astronomy Image Explorer. All Rights Reserved.
