

Image Details
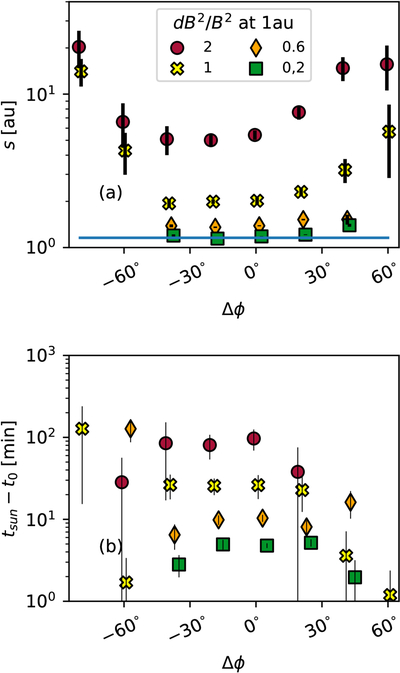
Caption: Figure 3.
The VDA apparent path length (a) and solar injection time relative to the simulation injection time t0 (b) of SEPs as a function of the observer heliolongitude for the very strong (red circles), strong (yellow crosses), moderate (orange diamonds), and weak (green squares) turbulence and energy-dependent onset threshold fraction f(E). The solid blue line shows the length of the nominal Parker spiral. In panel (b), the solar injection times for Δϕ = −80∘, 40∘, and 60∘ for the high turbulence case are omitted for clarity, as they are at tSun < −100 minutes. Note that the points from different turbulence sets are staggered by 1∘ to avoid overlapping of error bars.
Other Images in This Article
Copyright and Terms & Conditions
© 2026. The Author(s). Published by the American Astronomical Society.

