

Image Details
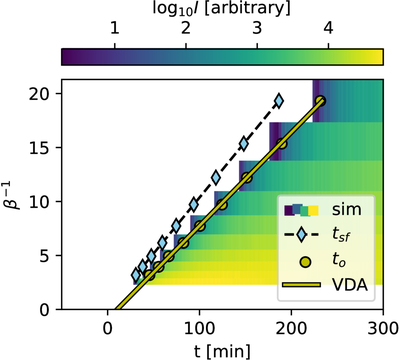
Caption: Figure 2.
The contour shows the simulated proton intensities as a function of inverse of velocity (in light-speed units) and time at Δϕ = 0∘, for the moderate turbulence case. The yellow circles are the onset times determined with Equation (6), and the yellow curve is the fit of the onset times to Equation (1). The blue diamonds, connected with the dashed line, show the arrival time of scatter-free protons along the nominal Parker spiral.
Other Images in This Article
Copyright and Terms & Conditions
© 2026. The Author(s). Published by the American Astronomical Society.

Copyright ©
2026 Astronomy Image Explorer. All Rights Reserved.
