

Image Details
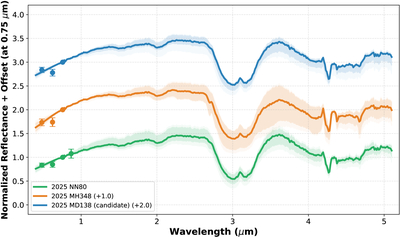
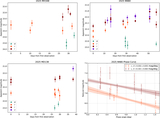
Caption: Figure 7.
Posterior predictive spectra inferred from the input gri or griz photometry, where circular markers and vertical error bars denote the input values and propagated uncertainties (normalized at the i band) used for the inference. Solid curves show the posterior median reconstruction, and darker/lighter shaded regions show the 68/90% predictive interval.
Other Images in This Article
Copyright and Terms & Conditions
© 2026. The Author(s). Published by the American Astronomical Society.

Copyright ©
2026 Astronomy Image Explorer. All Rights Reserved.
