

Image Details
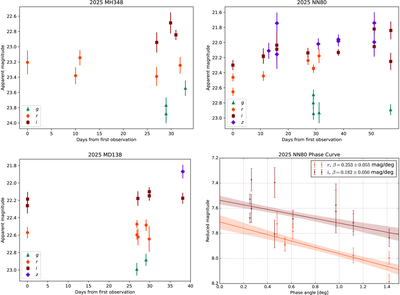
Caption: Figure 5.
Light curves (apparent magnitude per filter as a function of time) from the Rubin multiband photometry are displayed in the top row and bottom-left plots. Bottom right: the reduced magnitude measurements for 2025 NN80 in the r and i bands as a function of phase angle. The solid curve represents the best-fit phase curve for each band and the shaded region the 1σ contours.
Other Images in This Article
Copyright and Terms & Conditions
© 2026. The Author(s). Published by the American Astronomical Society.

Copyright ©
2026 Astronomy Image Explorer. All Rights Reserved.
