

Image Details
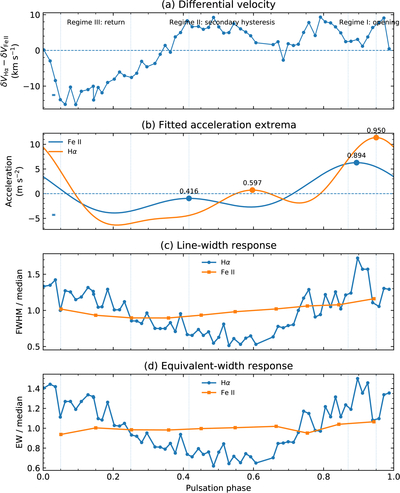
Caption: Figure 3.
Joint diagnostics for Y Crv. (a) Centered Hα–Fe II differential velocity. (b) Fitted Fe II and Hα acceleration curves; symbols identify the published secondary and primary extrema. (c) FWHM and (d) EW normalized to their median values, using the single Gaussian line profile measurements. Dotted vertical lines mark the operational phase boundaries used to illustrate the opening, secondary hysteresis, and return regimes; they are not interpreted as infinitely thin shock fronts. Representative formal velocity and acceleration errors are shown in panels (a) and (b).
Other Images in This Article
Copyright and Terms & Conditions
© 2026. The Author(s). Published by the American Astronomical Society.

Copyright ©
2026 Astronomy Image Explorer. All Rights Reserved.
