

Image Details
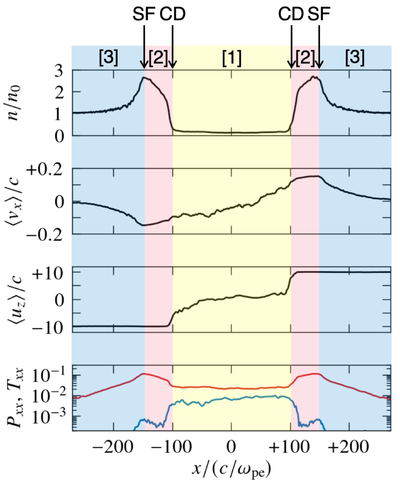
Caption: Figure 1.
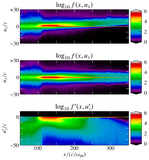
One-dimensional y-averaged profile for density (top), x-directional three-velocity (second from the top), z-directional four-velocity (third from the top), momentum tensor (bottom, red line), and Maxwell stress tensor (bottom, blue line) at tωpe = 600. The regions 1, 2, and 3 indicate the low-density region, the shock downstream, and the shock upstream, respectively. CD and SF represent the contact discontinuity and the shock front, respectively.
Other Images in This Article
Copyright and Terms & Conditions
© 2026. The Author(s). Published by the American Astronomical Society.

Copyright ©
2026 Astronomy Image Explorer. All Rights Reserved.
