

Image Details
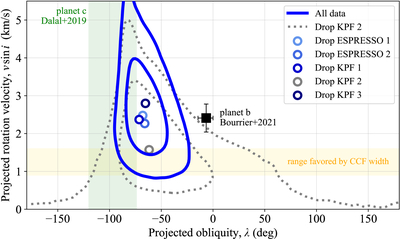
Caption: Figure 3.
Posterior probability density for the ﹩v\sin i﹩ and λ. Blue contours are the 68% and 95% levels based on fitting all five datasets. Dotted gray contours show the results of dropping the second KPF observation, the most discrepant of the five datasets. The circular data points show the maximum a posteriori results from each of the leave-one-out tests. The black square is from V. Bourrier et al. (2021). The yellow zone illustrates the range ﹩v\sin i\approx 0.9﹩–1.6 km s−1 favored by the CCF comparisons presented in Section 4. The green zone shows the measured projected obliquity of planet c (S. Dalal et al. 2019).
Other Images in This Article
Copyright and Terms & Conditions
© 2026. The Author(s). Published by the American Astronomical Society.

