

Image Details
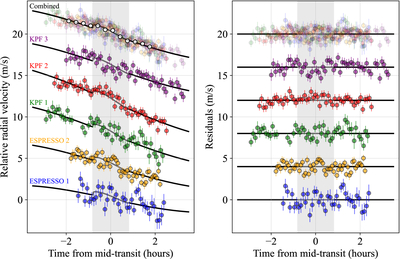
Caption: Figure 2.
The left panel shows the apparent radial velocities of HD 3167 b spanning five separate transits (colored points) and the best-fit consensus model including the RM effect (black curves). The right panel shows the residuals after subtracting the best-fit model. Arbitrary vertical offsets were applied to separate data from different nights. The lowermost dataset was analyzed by V. Bourrier et al. (2021). The uppermost is a composite of all the data, including phase-binned points for display purposes. The gray region is the transit interval.
Other Images in This Article
Copyright and Terms & Conditions
© 2026. The Author(s). Published by the American Astronomical Society.

Copyright ©
2026 Astronomy Image Explorer. All Rights Reserved.
