

Image Details
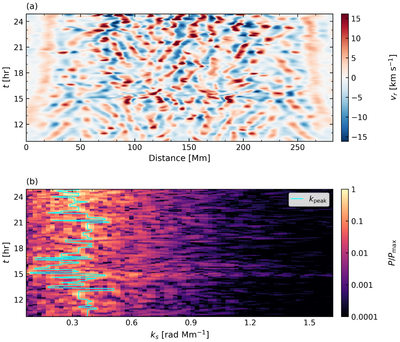
Caption: Figure D1.
(a) Radial-velocity keogram along a fixed line aligned with the prominence spine near its lower boundary. Red and blue indicate upflows and downflows. (b) Spatial Fourier power of the velocity in (a), normalized to the maximum over the full map. The cyan curve marks the peak at each time within the displayed wavenumber range.
Other Images in This Article
Copyright and Terms & Conditions
© 2026. The Author(s). Published by the American Astronomical Society.

Copyright ©
2026 Astronomy Image Explorer. All Rights Reserved.
