

Image Details
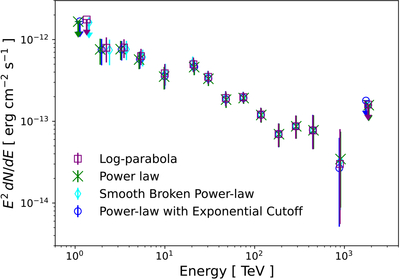
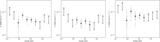
Caption: Figure B5.
Comparison of spectral fits to the joint (WCDA + KM2A) data. The four models—PL (green), LP (purple), PL with cutoff (blue) and SBPL (cyan)—are shown with their respective 1σ uncertainties. The LP provides the lowest AIC value, indicating mild but statistically significant curvature, while the PLEC gives a comparable fit without strong evidence for a cutoff.
Other Images in This Article
Show More
Copyright and Terms & Conditions
© 2026. The Author(s). Published by the American Astronomical Society.

Copyright ©
2026 Astronomy Image Explorer. All Rights Reserved.
