

Image Details
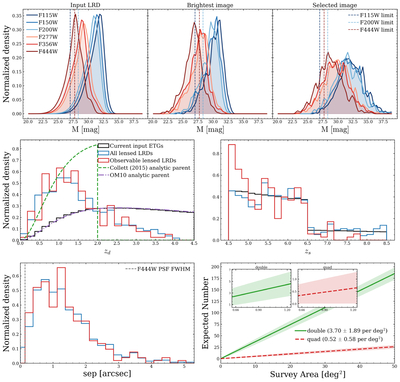
Caption: Figure 2.
Top row: magnitude distributions of the input LRD catalog (left), the brightest lensed image in each multiple-image system (middle), and the selected lensed image (right), defined as the second-brightest image for doubles and the third-brightest image for quads. The vertical dotted lines indicate the adopted representative 5σ limiting magnitudes in the three NIRCam bands. Middle row: redshift distributions of mock lensed LRDs, showing the lens redshift (left) and source redshift (right). Bottom row: distribution of the maximum image separation for mock lensed LRDs (left) and expected number of observable lensed LRDs as a function of cumulative JWST survey area (right). The vertical dashed line in the separation panel marks the adopted F444W PSF FWHM. In the survey-area panel, the shaded bands show the expected field-to-field scatter inferred from the 50 simulated 1 deg2 regions, and the two insets provide enlarged views of the double and quad predictions over 0.62–1.24 deg2.
Other Images in This Article
Copyright and Terms & Conditions
© 2026. The Author(s). Published by the American Astronomical Society.

