

Image Details
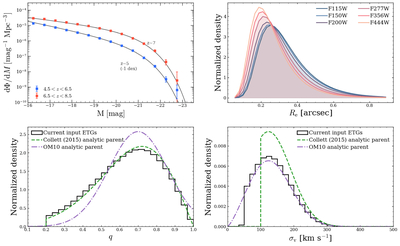
Caption: Figure 1.
Properties of the mock LRD and foreground-ETG populations. Upper-left panel: rest-frame UV luminosity functions of the mock LRD catalog in the two adopted redshift bins. The black curves show the input K24 Schechter functions, and the points show the corresponding distributions recovered from the mock catalog; the z ∼ 5 luminosity function is shifted downward by 1 dex for clarity. Upper-right panel: normalized distributions of the effective radius of ETGs in six simulated bands. Bottom-left and bottom-right panels: normalized distributions of the projected axis ratio, qlens, and velocity dispersion, σv, respectively, for the mock foreground ETGs, compared with the analytic parent distributions adopted by OM10 and T. E. Collett (2015).
Other Images in This Article
Copyright and Terms & Conditions
© 2026. The Author(s). Published by the American Astronomical Society.

