

Image Details
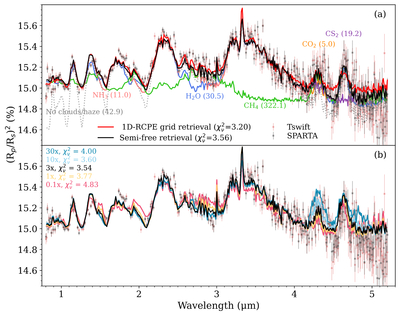
Caption: Figure 2.
Transmission spectra of TOI-6894 b from two independent reductions, compared to various models and their reduced χ2 values. We only considered 0.8–5.2 μm for modeling due to the sharp drop in PRISM throughput outside this range. (a) The SPARTA and Tswift spectra overlaid with the best-fit 1D-RCPE grid retrieval (solid red) and semi-free retrieval model (solid black). Colored curves show the best-fit semi-free model with each individual molecule removed. For each species, we reran the retrieval with that molecule’s opacity contribution muted and computed the log Bayes factor ﹩\mathrm{ln}(B)=\mathrm{ln}{Z}_{\mathrm{full}}-\mathrm{ln}{Z}_{\mathrm{mol},\mathrm{muted}}﹩ using PyMultiNest’s global evidence. The resulting ﹩\mathrm{ln}(B)﹩ are indicated in parentheses next to each label. ﹩\mathrm{ln}(B)\gt 5﹩ usually indicates a strong preference for the model (R. Trotta 2008). (b) RCP models assuming different metallicities (Section 3.1) are shown in colors, with their reduced ﹩{\chi }_{\nu }^{2}﹩ values listed in the legend. A clear preference for 3–10× solar metallicity over subsolar or 30× solar is apparent by eye, where the 30× model overpredicts CO2 (4.2–4.4 μm) along with OCS (4.8–5.0 μm), and the subsolar to solar models overpredict NH3 (1.95 μm, 1.5 μm, 2.95 μm) and underpredict CO2. The transmission spectrum is available as the data behind the figure.
(The data used to create this figure are available in the online article.)
(The data used to create this figure are available.)
Other Images in This Article
Copyright and Terms & Conditions
© 2026. The Author(s). Published by the American Astronomical Society.

