

Image Details
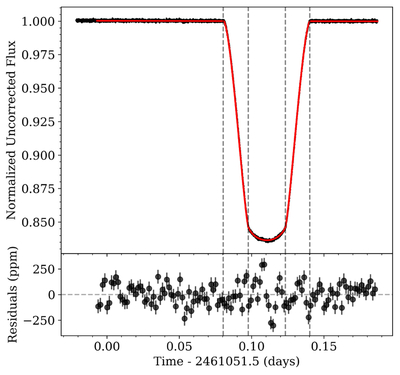
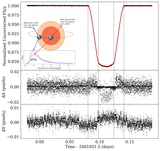
Caption: Figure 1.
The normalized, uncorrected white light curve of TOI-6894 b spanning 0.8–5.2 μm, with the best-fit transit model overplotted in red. The first 500 integrations are discarded to get rid of detector settling effects. The vertical dashed lines indicate the times of ingress and egress. Binned residuals are shown below with the y-axis magnified by a factor of 76 relative to the upper panel.
Other Images in This Article
Copyright and Terms & Conditions
© 2026. The Author(s). Published by the American Astronomical Society.

Copyright ©
2026 Astronomy Image Explorer. All Rights Reserved.
