

Image Details
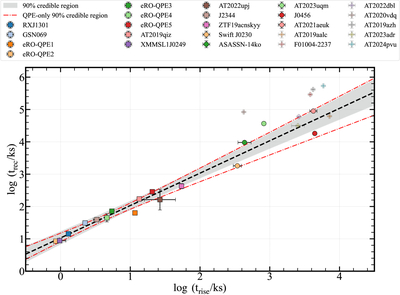
Caption: Figure 2.
The relation between the rise time and recurrence time for QPEs, RNTs, and rpTDE candidates. The statistical analysis includes only QPEs and RNTs. The rpTDE candidates are shown for comparison and to illustrate their location relative to the QPE and RNT populations, but they are not included in the correlation analysis. The dashed black line shows the best-fit relation obtained from a hierarchical Bayesian regression that accounts for uncertainties in both variables. The shaded region represents the 90% posterior credible region of the regression, derived from the posterior distributions of the slope and intercept and therefore incorporating their uncertainties and covariance. Squares denote QPEs, circles denote RNTs with at least three observed outbursts, and crosses denote RNTs with only two complete outbursts and rpTDE candidates. The red dashed–dotted lines mark the 90% posterior credible region inferred from a fit to the QPE-only sample, incorporating the posterior uncertainties of the regression parameters as well as the intrinsic scatter.
Other Images in This Article
Copyright and Terms & Conditions
© 2026. The Author(s). Published by the American Astronomical Society.

