

Image Details
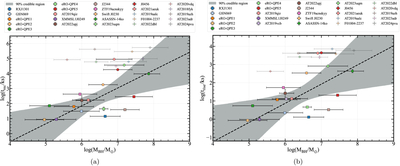
Caption: Figure 1.
The relation between the black hole mass and the recurrence time for QPEs, RNTs, and rpTDE candidates. The recurrence times are corrected to the source rest frame. QPEs, RNTs, and rpTDE candidates are shown as squares, circles, and pentagons, respectively. Only QPEs and RNTs are included in the statistical analyses presented in this work. The rpTDE candidates are shown for comparison but are not included in the statistical analysis. The black dashed line represents the median relation from a hierarchical Bayesian linear regression using the QPE and RNT samples, excluding AT 2021aeuk. The regression accounts for measurement uncertainties in both variables. The shaded region represents the 90% posterior credible region of the regression, derived from the posterior distributions of the slope and intercept and therefore incorporating their uncertainties and covariance.
Other Images in This Article
Copyright and Terms & Conditions
© 2026. The Author(s). Published by the American Astronomical Society.

