

Image Details
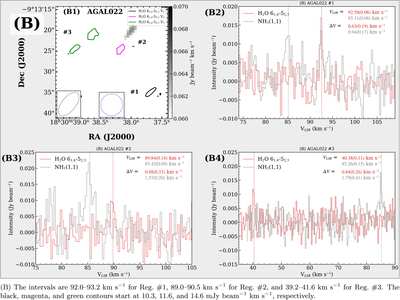
Caption: Figure 1.
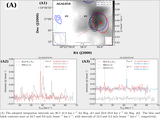
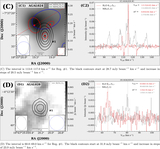
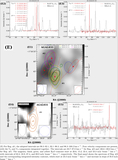
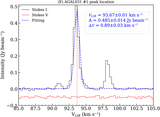
Velocity-integrated intensity maps of the NH3(1, 1) main line for the five clumps are shown as gray scale backgrounds. The 1.3 mm continuum cores and ammonia cores are marked by red and blue ellipses, respectively. Red dashed lines indicate the CO 2–1 outflow axes reported by S. Li et al. (2019b). Colored contours show the velocity-integrated intensities of individual water maser components, while the annotations in each subfigure indicate the corresponding velocity integration ranges and contour intervals. The black circle represents the synthesized beam of the water line observations, while the red and blue circles indicate the beam sizes of the SMA 1.3 mm continuum and VLA NH3(1, 1) observations, respectively. The gray and red spectra show the NH3(1, 1) and water lines, respectively, and the dashed vertical lines mark the velocities. The colored annotations indicate the parameters derived from the line fitting, where the ΔV values not deconvolved from the channel width. The figure labels are noted from A to E following the order of source names in Table 2.
Other Images in This Article
Copyright and Terms & Conditions
© 2026. The Author(s). Published by the American Astronomical Society.

